Funds, indexes, coins, currencies and commodities
On this page
Stocks are not the only things with prices. Finance has a page, like a stock's page, for exchange-traded funds (ETFs), mutual funds, stock indexes, coins, currency pairs, commodities, futures and bond yields. The top of the page, the chart and the news work the same way; what changes is the tabs and the statistics, because a fund has no earnings and a currency has no market cap.
#What is different
| Kind | Tabs | What the Key statistics show |
|---|---|---|
| Stock | Overview, Financials, Analysis, News, Predictions, Options, Profile, Filings | Earnings, valuation, dividend and short-interest figures |
| ETF | Overview, News, Predictions, Options, Fund | Net assets, expense ratio, yield, year-to-date return, 50-day and 200-day averages |
| Mutual fund | Overview, News, Fund | The same as an ETF, without Options |
| Index | Overview, News, Predictions | The 50-day and 200-day averages, the one-year change and volume |
| Coin | Overview, News, Predictions | Market cap, 24-hour volume, circulating supply, averages and the one-year change |
| Currency, commodity, future, rate | Overview, News, Predictions | Averages, the one-year change and, for futures, volume and open interest |
The Predictions tab appears on any page when three or more prediction markets are about it. See Prediction-market odds.
#Funds
An ETF or mutual fund holds many investments at once, and its page tells you what and at what cost.
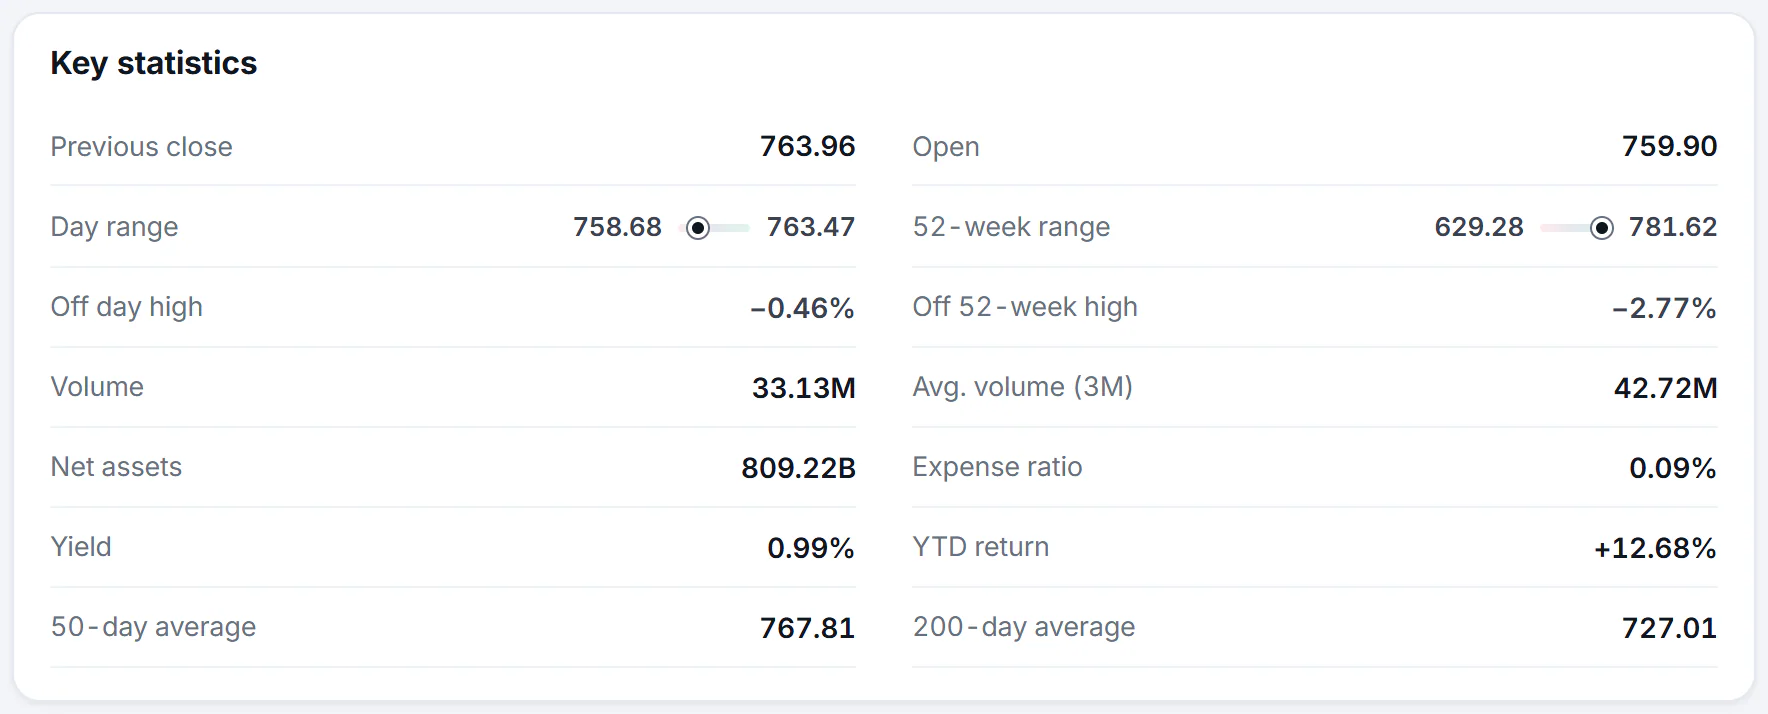
A fund's Key statistics. The expense ratio is the yearly cost of owning the fund.
- 1Net assets: what the fund holds in total
- 2Expense ratio: the yearly cost of owning it
- 3Yield
- 4Return so far this year
- Net assets: the total value of everything the fund holds.
- Expense ratio: the yearly fee, as a percent of what you have invested.
- Yield: the income the fund pays out, as a percent of its price.
- YTD return: how much the fund has gained or lost so far this year.
The side column's Top holdings card lists the fund's largest holdings, each linked to its own page, with a bar and the percentage of the fund it makes up. A fund's own daily holdings file supplies the list, and the card says the date it is as of. Sector weights under it show how the fund divides across sectors. The Fund tab shows a description of the fund, its fund family and category where known, and its holdings.
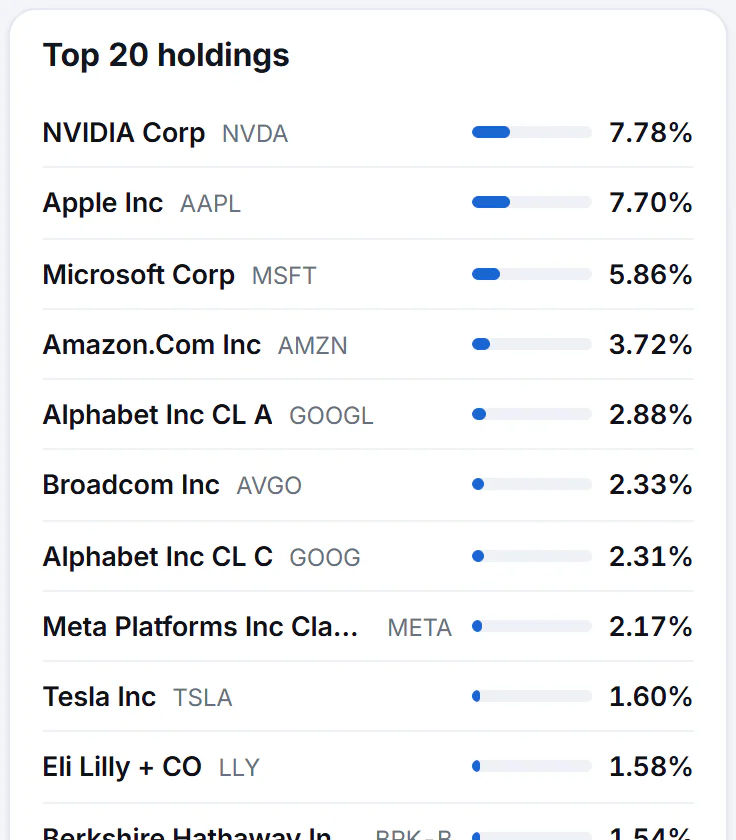
Each row is a holding. The bar and percentage show how much of the fund it makes up.
- 1The largest holding, and its share of the fund
- 2Share of the fund, with a bar
#Indexes
An index tracks a basket of stocks, such as the S&P 500. Its page shows the index level in points, and for many indexes a breadcrumb at the top leads to the family it belongs to. An Other indexes card lists its neighbors. See Indexes. Some indexes have no daily price history available, and for those the 52-week range is left out rather than shown wrongly.
#Coins
Coins trade around the clock, so the time line says As of the latest update instead of At close. The statistics show Volume (24h) and Circulating supply, the number of coins in existence. See Crypto and commodities.
#Currencies
A currency page is a pair. EUR/USD at 1.12 means one euro costs 1.12 U.S. dollars. The first currency is the one being priced and the second is the one it is priced in. See Currencies for the world table and the converter.
#Commodities, futures and yields
Oil, gold and similar markets are shown as futures contracts, usually the one that expires soonest. The Key statistics include Open interest, the number of contracts still open. A yield page, such as the 10-year Treasury yield, shows the yield in percent. See Crypto and commodities and Rates and bonds.
#Common questions
Why does a fund have no Financials tab?
Financial statements belong to companies. A fund has a Fund tab instead, with its holdings, costs and category.
Why do an index's numbers not look like prices?
An index has no price. Its level is a score calculated from the stocks in it, so it is measured in points, and its change is shown in points and in percent.
Are futures prices the price I would pay today?
Not exactly. A futures price is for delivery on a future date, so it can differ from the price for immediate delivery. Finance labels them front-month futures contracts.