Live maps: weather radar, earthquakes, wildfires and air quality
On this page
Four of the map types in the ribbon show what is happening now: Weather radar, Earthquakes, Wildfires and Air quality. Each comes from a public agency, and each page lists the biggest or worst right now, so you can jump straight to them.
Turn a live map on from the ribbon, from Live maps and layers on the Maps home, or from the Live group of the Layers menu. A color key appears at the bottom of the map while a live layer is on, and the credit at the bottom right names its source.
#Weather radar
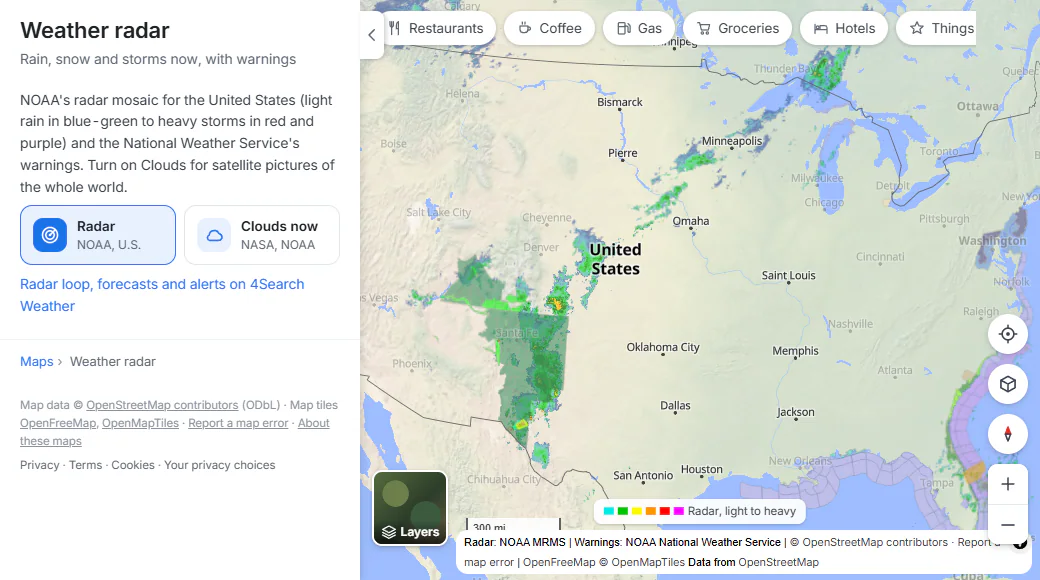
Radar over the United States: light rain in blue-green, heavy storms in red and purple.
- 1Switches: radar and clouds
- 2More radar and alerts on the Weather service
- 3Color key: light to heavy
- 4Who provides the data
- Radar shows rain and snow from NOAA's radar network over the United States (the lower 48 states, Alaska, Hawaii, Puerto Rico and Guam), with the National Weather Service's warnings drawn as colored outlines.
- Clouds now shows recent satellite pictures of the clouds over the whole world, from NASA and NOAA. Turn it on with the switch in the panel or in Layers.
- For a radar loop, forecasts and weather alerts, follow Radar loop, forecasts and alerts to the Weather service, on sites that have it.
The radar is a recent picture, not a moving loop. Reload the page for a newer one.
#Earthquakes
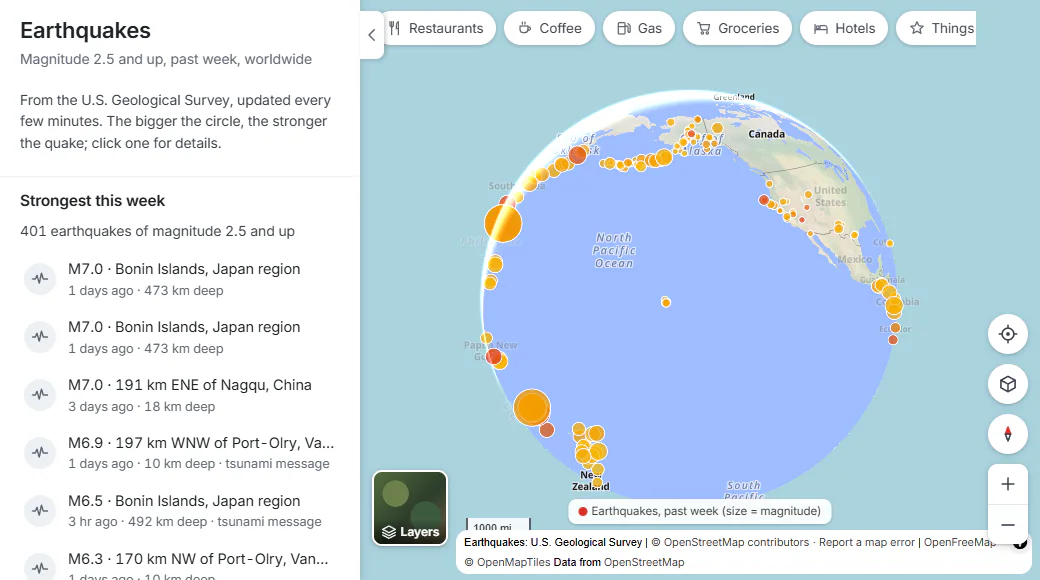
The past week's earthquakes. The bigger the circle, the stronger the quake; the redder, the more recent.
- 1The strongest of the past week
- 2Select a row to fly to that quake
- 3Bigger circle, stronger quake
- Every earthquake of magnitude 2.5 and up in the past week, worldwide, from the U.S. Geological Survey, updated every few minutes.
- Circle size shows the magnitude. Color shows how recent it is: red within the last day, then orange, then yellow for older ones. Zoomed in, the strongest show their magnitude inside the circle.
- Select a circle for its magnitude, place, date and time, depth, whether a tsunami message was issued, and a link to its USGS event page.
- The panel lists the Strongest this week and the Latest; select one to fly to it.
#Wildfires
- Active wildfires in the United States reported to the National Interagency Fire Center. The bigger the circle, the larger the fire; grey circles are fires that are fully contained. Mapped fire perimeters are shaded in orange with a red edge.
- Select a fire for its name, size in acres, how much is contained, when it started and its county.
- The panel shows how many fires are active and how many acres they cover, and lists the Largest active fires. Its second switch adds Air quality, to see where the smoke is.
#Air quality
- The air quality index (AQI) now at every AirNow reporting area, nearly all of them in the United States, from the EPA and its partners. It is updated hourly.
- Colors follow the standard scale: green good, yellow moderate, orange unhealthy for sensitive groups, red unhealthy, purple very unhealthy, maroon hazardous. Zoom in to see each area's number.
- Select a circle for its AQI, category, main pollutant and how long ago it was measured.
- The panel lists the Worst air now and says in how many reporting areas the air is good.
#Common questions
Why is there no radar over my country?
The radar layer covers the United States and its territories only. Clouds now covers the whole world.
How often do the live maps update?
Earthquakes every few minutes and air quality hourly, as their sources publish them. Reload the page to fetch the latest.
Why does a wildfire have no outline?
Only fires whose perimeter has been mapped and published show an outline. The others appear as a circle at their reported location.
Can I see earthquakes older than a week?
No. The map shows the past seven days. The USGS event page linked from each quake has its history and more detail.